
‘Debug’ name itself self-explanatory, means to identify and resolve bug. In addition, it makes easy to understand WordPress Core working by stepping into each line and live watch what is happening.
Debugging helped me a lot to actually understand WordPress hook system and call stack. I am using following tools as my primary development machine:
- macOS Big Sur [Version 11.2.3]
- Visual Studio Code [March 2021 (Version 1.55)]
- VVV (WordPress Virtual Development Environment) [Version 3.6.2]
- with Xdebug Support
Configuration
It is really easy to configure and start debugging with above mentioned tools. Once you have all in place, follow these steps:
Step 1 : Enable Xdebug on VVV
vagrant ssh -c "switch_php_debugmod xdebug"
Type above command into your VVV directory.
Step 2 : Install Visual Studio Code ‘PHP Debug Extension’
You need to install PHP Debug in your Visual Studio.
Step 3 : Configure launch.json
With VVV Version 3.6, launch.json is already included into base directory as shown below:
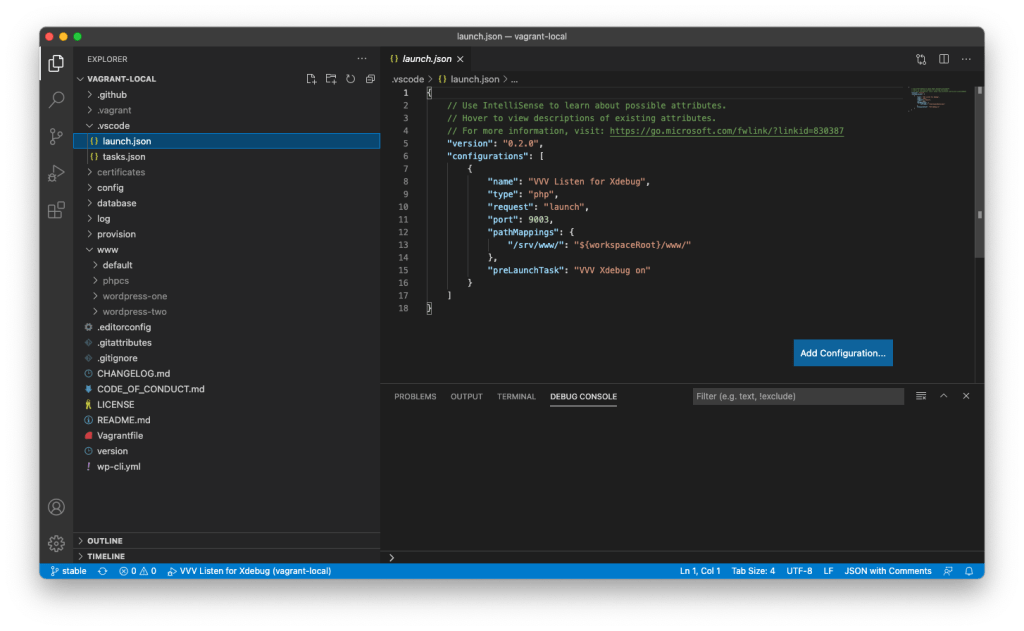
If not available, you can create one with following code snippet (refer VVV Xdebug for latest update) to configure debug:
{
	"version": "0.2.0",
	"configurations": [
		{
			"name": "VVV Listen for Xdebug",
			"type": "php",
			"request": "launch",
			"port": 9003,
			"pathMappings": {
				"/srv/www/": "${workspaceRoot}/www/"
			}
		}
	]
}
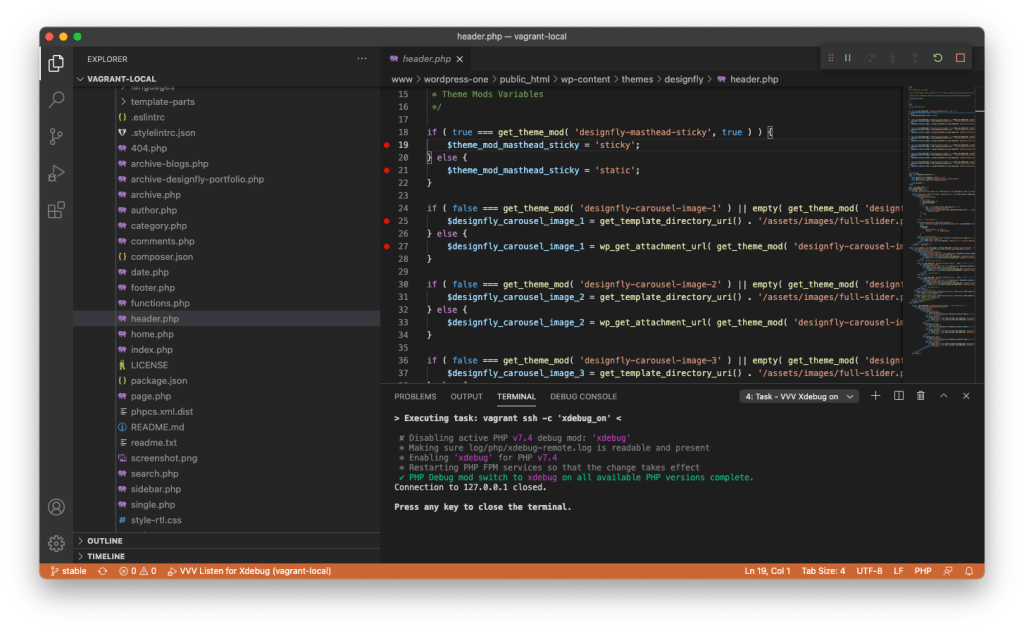
Step 4 : Start Debugging
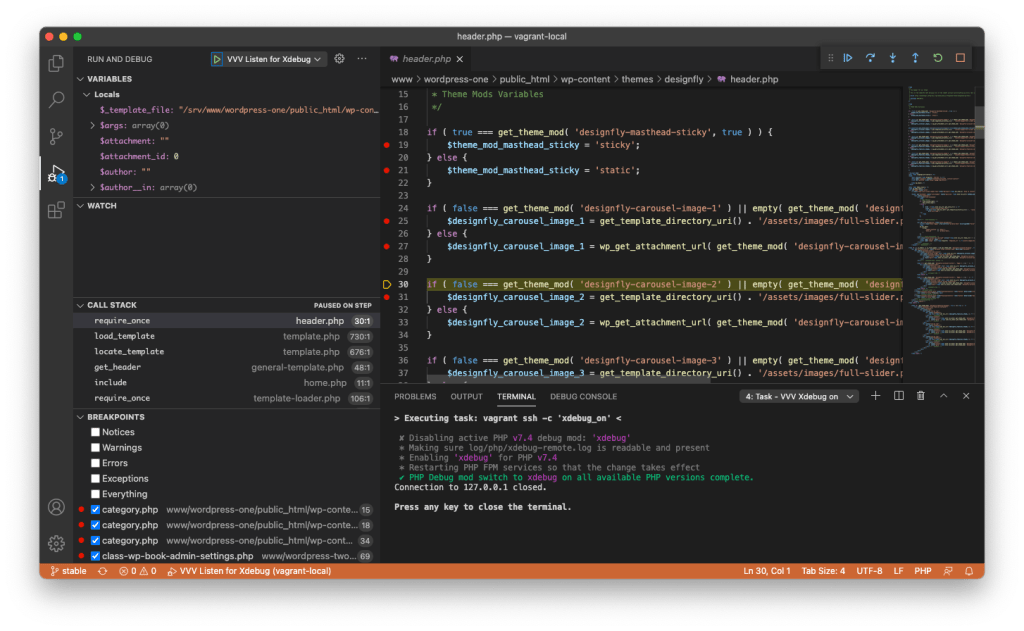
Press F5 or goto debug menu and start ‘VVV Listen for Xdebug’ to initiate VSCode connection to active Xdebug on VVV:
Now, go to your virtual WordPress site and see the magic !
Verdict
VVV comes with all tools needed to develop and debug a great WordPress site before deploying to actual server. On macOS, It is quit easy to configure and get started with Visual Studio having PHP Debug Extension and VVV with Xdebug enabled. On Windows, it is quit similar configuration process. Read VVV documentation for advance configurations.
Happy Debugging !

Leave a comment